ParaView tutorial
Time: 3 hours
Time: 3 hours
Thomas Theußl

Abstract:
In this tutorial, tailored towards beginners with little to no previous experience,
we will
introduce ParaView, a highly-scalable,
open-source,
multi-platform data analysis and visualization application built on top of VTK,
the Visualization Toolkit. ParaView users can quickly create visualizations to
analyze their data using qualitative and quantitative techniques. The data
exploration can be
done interactively in 3D. Attendees will participate in a hands-on session working
with ParaView
to create 3D visualizations of scientific datasets.
Thomas Theußl
is with Consivi KG in Deutschlandsberg, Austria, which he founded in 2025, offering
consulting,
support, and development in scientific visualization. His research interests include
visualization techniques, mathematical foundations of visualization, and
applications of
visualization. Theußl received his Master's degree in Computer Science from TU Wien
in Austria.
He has published tutorials on ParaView and Avizo on YouTube. Contact him at thomas.theussl@consivi.com.
Orange for Biomedical Data Analysis: From Visual Analytics Workflows to
Interactive Communication
Time: 3 hours
Time: 3 hours
Ajda Pretnar Žagar, Ela Praznik, Jaka Kokošar, Matej Bevec
Abstract:
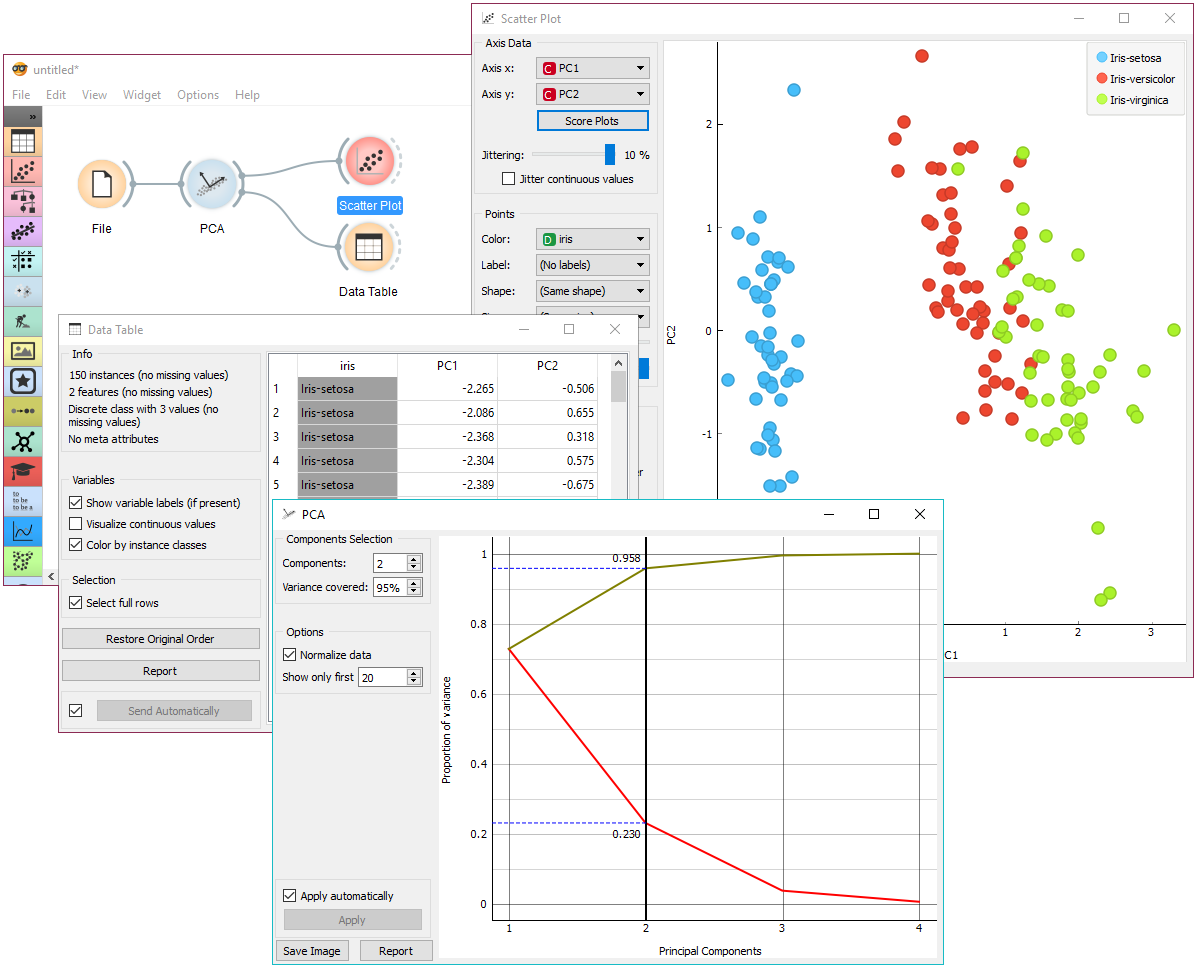
This hands-on workshop introduces Orange Data
Mining
as a visual programming environment for biomedical data analysis, starting with the basics
of visual programming and workflow design and progressing to practical biomedical data
analysis workflows. Participants will learn how to build interactive Orange workflows,
explore data visually, and apply them to case studies in single-cell gene expression
analysis and survival analysis. The workshop will conclude with Orange Lab, a web-based
version of Orange that also features component exposition, allowing selected workflow
elements to be embedded in interactive web pages while remaining connected to the underlying
analysis pipeline. The workshop will finish with an under-the-hood look at the Orange Lab
through a live vibe-coding session to demonstrate the creation of new visual analytics
components. The tutorial is tailored for beginners – no prior experience with Orange or the
Orange Lab frameworks is required.
Ajda Pretnar Žagar — visual programming in Orange; introductory
workflows and interactive data exploration.
Ela Praznik — biomedical workflows for single-cell gene expression analysis.
Jaka Kokošar — survival analysis, patient stratification, Kaplan–Meier workflows, and biomarker discovery.
Matej Bevec — Orange Lab, web-based workflows, component exposition, and custom widget prototyping.
Ajda Pretnar Žagar is a researcher specializing in computational anthropology and digital historiography. Her work bridges computer-based methods with the social sciences and humanities, with a particular focus on valuational studies, parliamentary data, and historical texts. As an expert in teaching data science, she has led over 100 data mining workshops for diverse audiences worldwide. She is also an active contributor to the Orange Data Mining development team.