| CEST | Monday, 17th May 2021 | Tuesday, 18th May 2021 | Wednesday, 19th May 2021 | Thursday, 20th May 2021 | Friday, 21st May 2021 |
|---|---|---|---|---|---|
| 14:00 |
Opening and Participants Introduction
|
Multiscale BioMedical Visualization
|
Foundations of Flow and Topological Data Analysis for the BioMedVis Domain
|
Visualization of Biological and Medical Time-varying Data
|
AR/VR in BioMedicine
|
| 14:15 | |||||
| 14:30 |
Visual Analytics for P4 Medicine
|
||||
| 14:45 | |||||
| 15:00 | |||||
| 15:15 |
Recent Advances in Image Denoising
|
Visualization, Exploration, and Analysis of Biomedical Volume Data
|
Multimodal Medical Visualization
|
The Dynamic Multi-Enzyme Pathway of Aerobic Respiration, from Glucose to ATP
|
A Critical Analysis of the Evaluation Practice in Medical Visualization
|
| 15:30 | |||||
| 15:45 |
Visualization for Diffusion-Weighted Imaging
|
Visualization of Vascular Structures
|
Factors to Consider in Visual Communication of Biomedical Topics
|
||
| 16:00 | |||||
| 16:15 | |||||
| 16:30 |
A Primer on Biomedical Data Sources
|
Visualization for Neuroscience and Connectomics
|
Visualizing Omics Data
|
How to do a Successful PhD (in Visual Computing)
|
Visual Exploration of Patterns and Relationships in Low-Dimensional Embeddings
|
| 16:45 | |||||
| 17:00 |
Telling stories with Procedurally Generated Images
|
Visualization to Make Medical Imaging AI Useful in the Clinical Wilderness
|
|||
| 17:15 | |||||
| 17:30 | |||||
| 17:45 |
Unitymol as an Example for Game-Engine Based Scientific Visualization: an Introductory Tutorial
|
VTK: A Brief Introduction
|
A Tour of d3
|
Biological Network Visualization
|
Can a Picture Save a 1000 Lives? BioVis in Clinical and Public Health Practices
|
| 18:00 | |||||
| 18:15 |
Color Fundamentals for Data Visualization
|
Visualization for AI in Critical Domains
|
|||
| 18:30 | |||||
| 18:45 | |||||
| 19:00 |
Visualization of Spatial Single-Cell Omics Data
|
Mentoring Visualization Designs
|
Visualization Analysis and Design
|
||
| 19:15 | |||||
| 19:30 |
Visualising the Human Metabolic Connectome using Total-Body PET
|
||||
| 19:45 |
Monday
14:00 - 15:00
Opening and Participants Introduction
Speaker: Organizers ()
15:00 - 15:15
Break
15:15 - 15:45
Recent Advances in Image Denoising
Speaker: Won-ki Jeong (Korea University)

Won-Ki Jeong is currently a professor in the department of computer science and engineering at Korea University. He was an assistant and associate professor in the school of electrical and computer engineering at UNIST (2011-2020), a visiting associate professor of neurobiology at Harvard Medical School (2017–2018), and a research scientist in the Center for Brain Science at Harvard University (2008–2011). His research interests include visualization, image processing, and parallel computing. He received a Ph.D. Degree in Computer Science from the University of Utah in 2008, and was a member of the Scientific Computing and Imaging (SCI) institute. He hosted the NVIDIA GPU Research Center at UNIST in 2014.
15:45 - 16:15
Visualization for Diffusion-Weighted Imaging
Speaker: Anna Vilanova (TU Eindhoven)
Prof .Dr. Anna Vilanova is full professor in visual analytics since October 2019, at the department of Mathematics and Computer Science, at the Eindhoven University of Technology (TU/e). She is also associated to the Electrical Engineering department within the Signal Processing Systems at TU/e. Previously she was associate professor for 6 years at the Computer Graphics & Visualization Group at EEMCS at the University of Deft, the Netherlands. From 2002 to August 2013, she was Assistant Professor at the Biomedical Image Analysis group of the Biomedical Engineering Department at TU/e. She is leading a research group in the subject of visual analytics and multivalued image analysis and visualization, focusing on Visual Analytics for high dimensional data. She focuses on Biomedical applications, Diffusion Weighted Imaging and 4D Flow.
16:15 - 16:30
Break
16:30 - 17:30
A Primer on Biomedical Data Sources
Speaker: Noeska Smit (University of Bergen and Haukeland University Hospital)

Noeska Smit is an Associate Professor (tenure track) in the visualization research group at the University of Bergen, Norway, since 2017, where she leads a team researching multimodal medical visualization. She is also affiliated to the Mohn Medical Imaging and Visualization (MMIV) centre as a senior researcher at the Haukeland University Hospital. After working as a radiographer for three years, she completed her studies in Computer Science at the Delft University of Technology, the Netherlands, specializing in Computer Graphics and Visualization in 2012. In 2016, she obtained her PhD in medical visualization at the same institute in collaboration with the Anatomy and Embryology department at the LUMC in Leiden. Currently, she is researching novel interactive visualization approaches for multimodal medical imaging data. Her current focus in this context is on multi-parametric MR acquisitions.
16:30 - 17:30
A Primer on Biomedical Data Sources
Speaker: Jan Byska (Masaryk University, University of Bergen)
Jan Byška is Assistant professor at Masaryk University and Adjunct Associate Profesor at Universtity of Bergen. His work focuses on various challenges in the field of visualization of biomolecular and spatio-temporal data. Together with his colleagues he develops multiple software tools for visualization of molecular data among the most notable CAVER Analyst. He received his master's degree in Computer Graphics from the Masaryk University, Brno in 2011 and his PhD in 2016 from the same university. Since finishing his Ph.D., Dr. Byška spent 3 year as a postdoc at University of Bergen and is actively participating in the organization of multiple scientific events in the field of visualization (VCBM, EuroVis, BioVis, MolVA).
17:30 - 17:45
Break
17:45 - 18:45
Unitymol as an Example for Game-Engine Based Scientific Visualization: an Introductory Tutorial
Speaker: Marc Baaden (CNRS Paris)
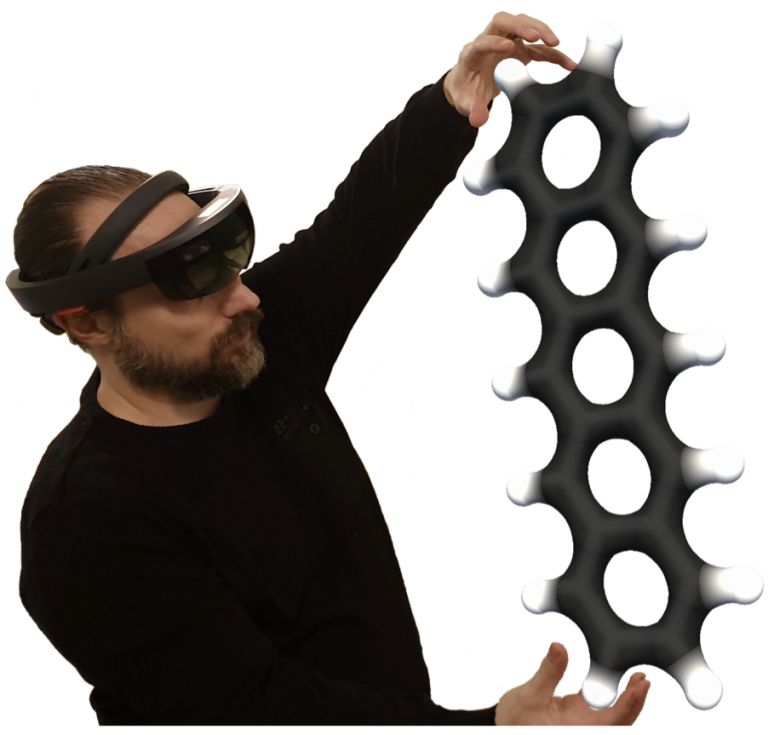
Dr. Marc Baaden is a computational chemist who works on modeling biological systems and processes at the molecular and atomic level. Work includes both application of existing packages like Amber, Gromacs, Yasara and NAMD but also development of novel software and exploration of innovative methods (like for example virtual reality and haptics). A broad range of methods is used from simple minimization via coarse grained modeling up to molecular dynamics and docking approaches. In addition, he develops molecular visualization applications such as HyperBalls and UnityMol. A recent orientation concerns the FAIR sharing of such data and experiences. He is actively collaborating with experimental groups, linking and validating computational observations with data from crystallography, NMR spectroscopy and electrophysiology. Marc is Directeur de Recherche de 1ère classe and Director of the CNRS UPR 9080 laboratory, Paris.
18:45 - 19:00
Break
19:00 - 19:30
Visualization of Spatial Single-Cell Omics Data
Speaker: Nils Gehlenborg (Harvard University)

Nils Gehlenborg, PhD, is an Assistant Professor in the Department of Biomedical Informatics at Harvard Medical School, Director of the Master in Biomedical Informatics program, and Director of the Biomedical Informatics and Data Science Research Training (BIRT) program. The goal of Nils’ research is to improve human health by developing visual interfaces and computational techniques that enable scientists and clinicians to efficiently interact with biomedical data. Tight integration of algorithmic approaches from biomedical informatics with advanced data visualization techniques is central to his efforts, as is close collaboration with clinicians and experimentalists.
19:30 - 20:00
Visualising the Human Metabolic Connectome using Total-Body PET
Speaker: Thomas Beyer (Quantitative Imaging and Medical Physics Team, Medical University of Vienna)
Thomas Beyer is Full Professor of Physics of Medical Imaging at the Medical University of Vienna; he holds a PhD in Physics from the University of Surrey/UK and an MBA in Innovation/Entrepreneurship from WU Vienna/AT. He is co-developer of the first combined PET/CT system worldwide. He has a background in research and project management in academia and in imaging industry. Lately, Thomas engages in the exploration of the human functional connectome using total-body PET imaging.
19:30 - 20:00
Visualising the Human Metabolic Connectome using Total-Body PET
Speaker: Lalith Kumar (Quantitative Imaging and Medical Physics Team, Medical University of Vienna)
Lalith Kumar Shiyam Sundar is a Post-doctoral Researcher at the Quantitative Imaging and Medical Physics (QIMP) Team, Medical University of Vienna. He obtained his Bachelor’s degree in Biotechnology in 2011, Anna University (India). Following a brief stint as a Mainframe Programmer in Cognizant Technology Solutions (India), he moved to Germany to pursue his Master’s studies in Biomedical Engineering at the RWTH Aachen University. In 2016, he finished his Diploma thesis on preclinical attenuation correction for PET/MR hybrid systems at the Physics of Molecular Imaging Systems, RWTH Aachen University. Subsequently, he moved to Vienna to obtain a PhD in Medical Physics, at the QIMP Team. During his PhD studies, he established a clinically viable computational framework, to determine the cerebral metabolic rate of glucose in a fully-automatic and non-invasive manner, by using the synergistic information provided by an integrated PET/MR. He is currently developing data-analytics schemes for probing the human metabolic connectome using extended field-of-view PET/CT systems.
Tuesday
14:00 - 15:00
Multiscale BioMedical Visualization
Speaker: Helwig Hauser (University of Bergen)
Helwig Hauser is professor in visualization and the leader of the Center for Data Science, CEDAS, at the University of Bergen (UiB), Norway. Before joining UiB in 2007 to build up a new research group on visualization (vis.UiB.no), Helwig Hauser was the Scientific Director of the VRVis Research Center in Vienna, Austria, where he earlier had led the basic research group on visualization (since 2000). Helwig Hauser got his education (in Computer Science, with specialization on visualization) from the Vienna University of Technology in Austria (TU Wien), where he also completed his PhD in 1998 and his Habilitation in 2003 (later awarded by the Heinz Zemanek Award). Since 2019, Helwig Hauser is the leader of UiB’s new Center for Data Science, CEDAS (UiB.no/cedas), with a particular focus on interdisciplinary research in data science, as well as data science education and applications.
15:00 - 15:15
Break
15:15 - 16:15
Visualization, Exploration, and Analysis of Biomedical Volume Data
Speaker: Stefan Bruckner (University of Bergen)
Stefan Bruckner is professor in visualization at the Department of Informatics of the University of Bergen in Norway. He investigates methods for gaining insight into complex data to further scientific understanding and discovery, medical diagnosis and treatment, and engineering, as well as techniques for communicating these findings to the public. Building on these foundations, his current interests include the development of novel interactive approaches for the inquiry of large-scale heterogeneous data spaces in data-driven science. Before his professorial appointment in Bergen in 2013, he was an assistant professor at the TU Wien, Austria where he also received his Ph.D. in Computer Science in 2008 and was awarded the habilitation degree (venia docendi) in Practical Computer Science in 2012. He has co-authored over 100 research papers on a variety of topics in visual computing including work on areas such as illustrative visualization, volume rendering, smart visual interfaces, biomedical data visualization, and visual parameter space exploration. He was program co-chair of EuroVis, PacificVis, the Eurographics Workshop on Visual Computing for Biology and Medicine, the Eurographics Medical Prize, and is an associate editor of the journal Computers & Graphics. He currently serves on the Eurographics Executive Committee, is an ACM Distinguished Speaker, as well as a member of ACM SIGGRAPH, Eurographics, and the IEEE Computer Society.
15:15 - 16:15
Visualization, Exploration, and Analysis of Biomedical Volume Data
Speaker: Michael Krone (University of Tübingen)
Michael Krone is a junior professor for Big Data Visual Analytics in Life Sciences at the department of computer science at the Eberhard Karls University of Tübingen in Germany, where he is also a member of the Interfaculty Institute for Biomedical Informatics (IBMI). Before that, he was a postdoctoral researcher at the Visualization Research Center of the University of Stuttgart and a guest lecturer at the Ludwig Maximilian University of Munich. He received a diploma and a Ph.D. (Dr. rer. nat., summa cum laude) in computer science from the University of Stuttgart, Germany. His research interests include visualization, computer graphics, GPU computing, and human-computer interaction in general with a focus on molecular visualization, visual analysis of biomedical data, web-based visualization, and interactive visual exploration of large data. He was general co-chair of the Eurographics Workshop on Visual Computing for Biology and Medicine 2020 and Biovis@ISBM 2021, and is an associate editor of the journal Frontiers in Bioinformatics. He is a member of Eurographics and the IEEE Computer Society.
16:15 - 16:30
Break
16:30 - 17:00
Visualization for Neuroscience and Connectomics
Speaker: Johanna Beyer (Harvard University)
Johanna Beyer is a research associate and lecturer at the Visual Computing Lab at Harvard University. Before joining Harvard, she was a postdoctoral fellow at the Geometric Modeling and Scientific Visualization Center at KAUST. She received her Ph.D. in computer science at the University of Technology Vienna, Austria in 2009. Her research focuses on GPU-based volume rendering techniques for large-scale neuroscience and medical data, with emphasis on visualization of large and multimodal volumes.
17:00 - 17:30
Telling stories with Procedurally Generated Images
Speaker: Peter Mindek (Nanographics)
Peter Mindek is a co-founder and CTO of nanographics, a Vienna-based startup developing technology for visualization and storytelling. He received his doctoral degree from TU Wien in 2015, where he also worked as a post-doctoral researcher in the area of biological visualization. His research interests include scientific visualization, storytelling, molecular graphics, and software architecture.
17:30 - 17:45
Break
17:45 - 18:45
VTK: A Brief Introduction
Speaker: Will Schroeder (Kitware, Inc.)
Will was trained as a mechanical engineer (BS University of Maryland) and received MS and PhD degrees in Applied Mathematics from Rensselaer Polytechnic Institute. After working for GE Power Systems and GE Research, Dr. Schroeder co-founded Kitware, Inc. Kitware was initially created to support the VTK visualization software toolkit (of which Will remains a core developer), and has since grown to over 200 employees with business and offices located worldwide, developing dozens of open source platforms supporting technology areas such as medical computing, computer vision, high performance computing and visualization, data & analytics, and software process though its CMake build tool.
18:45 - 19:00
Break
19:00 - 20:00
Mentoring Visualization Designs
Speaker: Martin Krzywinski (Canada's Michael Smith Genome Sciences Centre at BC Cancer)
Martin Krzywinski is known for his work in bioinformatics, data visualization and the interface of science and art. He applies design, both data and artistic, to assist discovery, explanation and engagement with scientific data and concepts. His information graphics have appeared in the New York Times, Wired, Scientific American and covers of numerous books and scientific journals such as Nature and Genome Research.
Wednesday
14:00 - 15:00
Foundations of Flow and Topological Data Analysis for the BioMedVis Domain
Speaker: Ingrid Hotz (Linköping University)
Ingrid Hotz is a professor in Scientific Visualization at Linköping University, Sweden. She received her M.S. degree in theoretical Physics from the LMU Munich, Germany and the PhD degree from the CS Department at the University of Kaiserslautern, Germany. Since then she has spent some time at the University of California Davis, at the Zuse Institute in Berlin, and at the German Aerospace Center (DLR). Currently she leads the Scientific Visualization Group at the division for Media and Information Technology at LiU. She is serving as Chair of the international workshop series for ‘Topological Methods in Visualization (TopoinVis)’ and is the coordinator of the Swedish e-sciences Research Center (SeRC) Visualization Community. Her research interest lies in the area of data analysis and scientific visualization, ranging from basic research questions to effective solutions to visualization problems in applications including flow analysis, engineering, physics, and medical applications. Her research builds on ideas and methods originating from different areas of computer sciences and mathematics, such as computer graphics, computer vision, dynamical systems, computational geometry, and combinatorial topology.
14:00 - 15:00
Foundations of Flow and Topological Data Analysis for the BioMedVis Domain
Speaker: Vijay Natarajan (IISc Bangalore - Indian Institute of Science)
Vijay Natarajan is the Mindtree Chair Professor in the Department of Computer Science and Automation at Indian Institute of Science, Bangalore. He received his Ph.D. in computer science from Duke University and holds the B.E. degree in computer science and M.Sc. degree in mathematics from BITS Pilani. His research interests include scientific visualization, computational geometry, and computational topology. In current work, he is developing topological methods for time-varying and multi-field data visualization, and studying applications in biology, material science, and climate science. [https://www.csa.iisc.ac.in/~vijayn]
15:00 - 15:15
Break
15:15 - 15:45
Multimodal Medical Visualization
Speaker: Noeska Smit (University of Bergen and Haukeland University Hospital)
Noeska Smit is an Associate Professor (tenure track) in the visualization research group at the University of Bergen, Norway, since 2017, where she leads a team researching multimodal medical visualization. She is also affiliated to the Mohn Medical Imaging and Visualization (MMIV) centre as a senior researcher at the Haukeland University Hospital. After working as a radiographer for three years, she completed her studies in Computer Science at the Delft University of Technology, the Netherlands, specializing in Computer Graphics and Visualization in 2012. In 2016, she obtained her PhD in medical visualization at the same institute in collaboration with the Anatomy and Embryology department at the LUMC in Leiden. Currently, she is researching novel interactive visualization approaches for multimodal medical imaging data. Her current focus in this context is on multi-parametric MR acquisitions.
15:45 - 16:15
Visualization of Vascular Structures
Speaker: Gabriel Mistelbauer (Otto-von-Guericke University Magdeburg)
Gabriel Mistelbauer is a postdoctoral researcher at the Otto-von-Guericke University Magdeburg, Germany since 2016. Previously, he was a postdoctoral researcher at TU Wien, Austria, where he received his PhD in computer science in the field of medical visualization in 2013. His research focuses on visual computing in medicine and medical image processing, but in particular on the analysis of vascular structures.
16:15 - 16:30
Break
16:30 - 17:30
Visualizing Omics Data
Speaker: Alex Lex (University of Utah)
I am an Associate Professor of Computer Science at the Scientific Computing and Imaging Institute and the School of Computing at the University of Utah. I run the Visualization Design Lab where we develop visualization methods and systems to help solve today’s scientific problems. Before joining the University of Utah, I was a lecturer and post-doctoral visualization researcher at Harvard University. I received my PhD, master’s, and undergraduate degrees from Graz University of Technology. In 2011 I was a visiting researcher at Harvard Medical School. I am the recipient of an NSF CAREER award and multiple best paper awards or honorable mentions at IEEE VIS, ACM CHI, and other conferences. I also received a best dissertation award from my alma mater. I co-founded Datavisyn (http://datavisyn.io), a startup company developing visual analytics solutions for the pharmaceutical industry. http://alexander-lex.net
17:30 - 17:45
Break
17:45 - 18:45
A Tour of d3
Speaker: Michael Oppermann (University of British Columbia)
Michael Oppermann is a Ph.D. candidate in Computer Science at the University of British Columbia. His current research focuses on information seeking in large-scale visualization collections and more broadly on data-driven prototyping. Prior to the doctoral program, he received a master's degree in Business Informatics from the University of Vienna. Michael uses D3 extensively in his visualization projects and helped develop D3 teaching material that is used at multiple universities.
18:45 - 19:00
Break
19:00 - 20:00
Visualization Analysis and Design
Speaker: Tamara Munzner (University of British Columbia)
Tamara Munzner is a Professor of Computer Science at the University of British Columbia. She holds a PhD from Stanford and has been active in the visualization field for over 30 years. Her longstanding engagement with the IEEE VGTC community includes service as InfoVis and EuroVis Papers Co-Chair, and chair of the VIS Restructuring Committee, the VIS Executive Committees, and the InfoVis Steering Committee. She published the book "Visualization Analysis and Design" in 2014 as the first in the AK Peters Visualization Series (CRC Press), and continues as series editor. She received the IEEE VGTC Visualization Technical Achievement Award in 2015.
Thursday
14:00 - 15:00
Visualization of Biological and Medical Time-varying Data
Speaker: Silvia Miksch (TU Wien)
Silvia Miksch is University Professor and head of the Research Division “Visual Analytics” (CVAST), Institute of Visual Computing and Human-Centered Technology, TU Wien. She served as paper co-chair of several conferences including IEEE VAST 2010, 2011 and 2020 and VIS Overall Papers Chair (IEEE VIS 2021) as well as EuroVis 2012 and on the editorial board of several journals including IEEE TVCG and CGF. She acts in various strategic committees, such as the VAST steering committee and the VIS Executive Committee. In 2020 she was inducted into The IEEE Visualization Academy. Her main research interests are Visualization/Visual Analytics (particularly Focus+Context and Interaction) and Time.
14:00 - 15:00
Visualization of Biological and Medical Time-varying Data
Speaker: Barbora Kozlikova (Masaryk University)
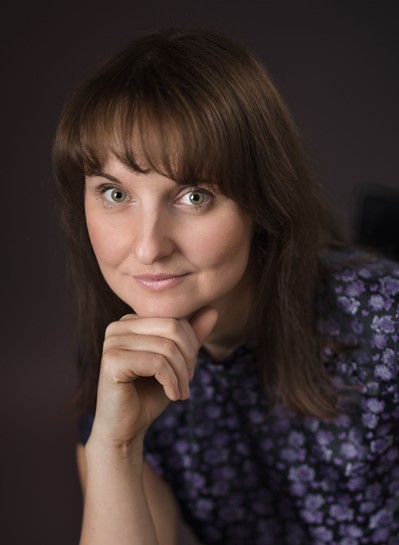
Barbora Kozlikova is an Associate Professor at the Masaryk University in Brno, Czech Republic, where she established and is heading Visitlab, the research laboratory focusing on designing visualizations for different application domains. One of the core topics is the visualization and visual analysis of biomolecular structures, with specific focus on molecular dynamics simulations, molecular docking, and molecular interactions. In the laboratory, we are also experimenting with virtual reality and its application in molecular modeling and education.
15:00 - 15:15
Break
15:15 - 15:45
The Dynamic Multi-Enzyme Pathway of Aerobic Respiration, from Glucose to ATP
Speaker: Drew Berry (WEHI, Melbourne Australia)
Drew Berry is a biomedical animator who creates beautiful, accurate visualisations of the dramatic cellular and molecular action that is going on inside our bodies. Beginning his career as a cell biologist, Drew is fluent navigating technical reports, research data and models from scientific journals. As an artist he works as translator, transforming abstract and complicated scientific concepts into vivid and meaningful visual journeys. Since 1995 he has led biomedical animation within the Walter and Eliza Hall Institute of Medical Research, Australia. His animations have exhibited at the Guggenheim Museum, MoMA, V&A, the Royal Institute of Great Britain and the University of Geneva. In 2010, he received a MacArthur Fellowship “Genius Grant”.
15:45 - 16:15
Factors to Consider in Visual Communication of Biomedical Topics
Speaker: Laura Garrison (University of Bergen & Mohn Medical Imaging and Visualization Centre)
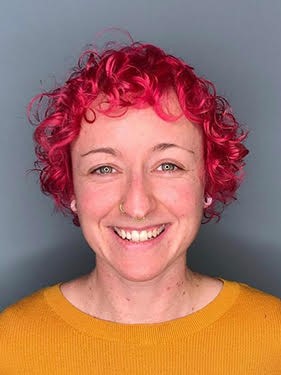
Laura Garrison is a PhD candidate in visualization under the supervision of Stefan Bruckner at the University of Bergen and Mohn Medical Imaging and Visualization Centre in Bergen, Norway. Drawing from her previous training and career as a biomedical artist, she fascinated by our interpretation of visual data as it relates to our health. Her research focuses visual encoding and interaction methods for biomedical data that can improve health literacy at multiple levels, from analysis to outreach. Her approach to this work is innovative in its collaborative and multidisciplinary approach. In her free time you can find her either biking or chasing her dog through the mountains, usually with a coffee in hand.
16:15 - 16:30
Break
16:30 - 17:30
How to do a Successful PhD (in Visual Computing)
Speaker: Eduard Gröller (TU Wien)
Eduard Gröller is Professor at the Institute of Visual Computing & Human-Centered Technology (VC&HCT), TU Wien, where he is heading the Research Unit of Computer Graphics. He is a scientific proponent and key researcher of the VRVis research center. The center performs applied research in visualization, rendering, and visual analysis. Dr. Gröller is Adjunct Professor of Computer Science at the University of Bergen, Norway. His research interests include computer graphics, visualization, and visual computing. He became a fellow of the Eurographics Association in 2009. Dr. Gröller is the recipient of the Eurographics 2015 Outstanding Technical Contributions Award and of the IEEE VGTC 2019 Technical Achievement Award.
17:30 - 17:45
Break
17:45 - 18:15
Biological Network Visualization
Speaker: Hsiang-Yun Wu (TU Wien)
Hsiang-Yun Wu is Postdoctoral Research Fellow at the Institute of Visual Computing \& Human-Centered Technology, TU Wien, Austria. She received her PhD from The University of Tokyo, Japan in 2013. Her research interests include the algorithm development of customized network representations and she has been working on map visualization and complex network visualization such as biological pathways and road networks.
18:15 - 18:45
Color Fundamentals for Data Visualization
Speaker: Theresa-Marie Rhyne (Color Maven/Visualization Expert)
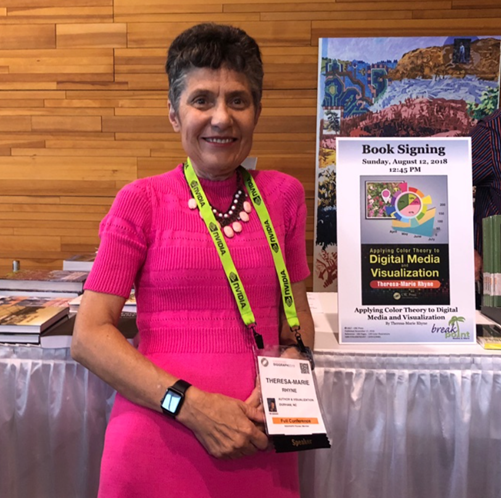
Theresa-Marie Rhyne is a visualization expert who specializes in applying Color Theory to Data Visualizations. She has consulted with the Stanford University Visualization Group on a Color Suggestion Prototype System, the Center for Visualization at the University of California at Davis and the Scientific Computing and Imaging Institute at the University of Utah on applying color theory to Ensemble Data Visualization. Prior to her consulting work, she founded two visualization centers: (a) the United States Environmental Protection Agency’s Scientific Visualization Center in the 1990s and (b) the Center for Visualization and Analytics at North Carolina State University in the 2000s. Her book on “Applying Color Theory to Digital Media and Visualization” was published by CRC Press in November 2016. In 2020, she began to write practitioner articles for Nightingale, the Journal of the Data Visualization Society.
18:45 - 19:00
Break
19:00 - 20:00
Social Event
Friday
14:00 - 14:30
AR/VR in BioMedicine
Speaker: Pere Pau Vazquez (Universitat Politècnica de Catalunya)
Pere-Pau Vázquez is an associate professor in the Computer Science Department at the Universitat Politècnica de Catalunya in Barcelona. He is a member of the Research Center for Visualization, Virtual Reality, and Graphics Interaction (ViRVIG). He has been working in the areas of Scientific Visualization and Computer Graphics for more than 20 years. His main interests are the visualization of biomedical models, the development of novel visual analysis techniques for large data sets, as well as interaction in Virtual Reality environments. After graduating in Computer Science (1999), he obtained a Ph.D. in Software (2003) at Universitat Politècnica de Catalunya.
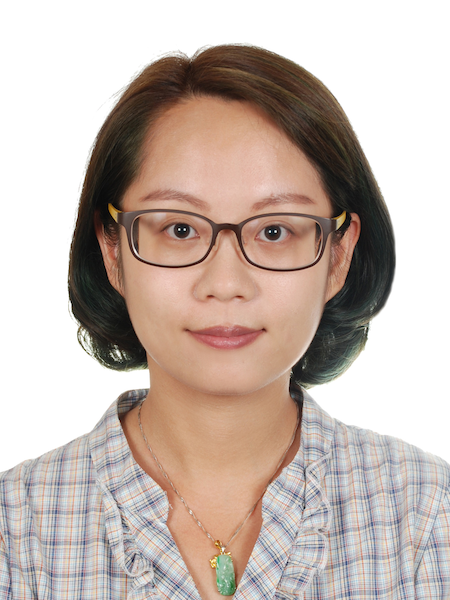
14:30 - 15:00
Visual Analytics for P4 Medicine
Speaker: Renata Raidou (TU Wien and University of Groningen)
Renata Raidou is Assistant Professor in Medical Visualization and Visual Analytics at TU Wien, Austria. Previously, she was Assistant Professor at the University of Groningen, the Netherlands. She received her Ph.D. from Eindhoven University of Technology, the Netherlands, in 2017. For the results of her dissertation, she obtained the Best PhD Award 2018 of the EuroVis Awards Programme, and she was awarded the Dirk Bartz Prize for Visual Computing in Medicine (1st Place) at Eurographics 2017. Her research focus is on the interface between Visual Analytics, Image Processing, and Machine Learning, with a strong focus on medical applications—in particular, cancer radiotherapy. Her domains of expertise are Comparative Visual Analytics and Uncertainty Visualization. She is also very enthusiastic about Data Physicalization in the context of Anatomical Edutainment.
15:00 - 15:15
Break
15:15 - 16:15
A Critical Analysis of the Evaluation Practice in Medical Visualization
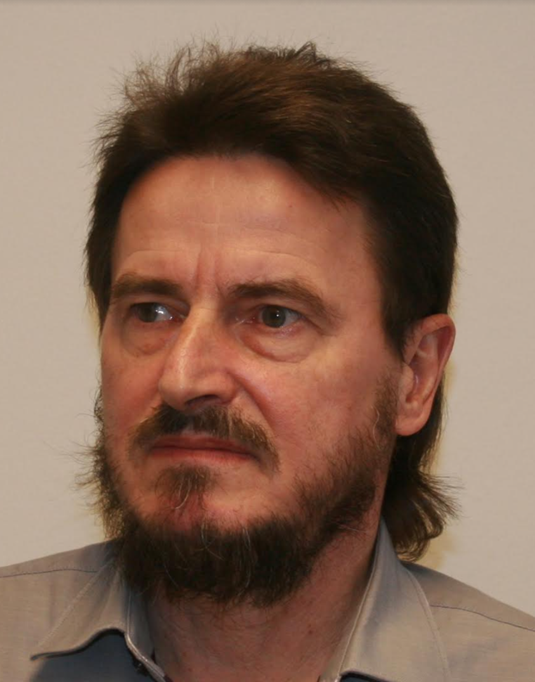
Speaker: Bernhard Preim (Otto-von-Guericke University Magdeburg)
Bernhard Preim was born in 1969 in Magdeburg, Germany. He received the diploma in computer science in 1994 (minor in mathematics) and a Ph.D. in 1998 from the Otto-von-Guericke University of Magdeburg. In 1999 he moved to Bremen where he joined the staff of MeVis. In close collaboration with radiologists and surgeons he directed the work on "computer-aided planning in liver surgery". In June 2002 he received the Habilitation degree (venia legendi) for computer science from the University of Bremen. Since Mars 2003 he is full professor for "Visualization" at the Otto-von-Guericke-University of Magdeburg,heading a research group focussed on medical visualization and applications in surgical education and surgery planning.
16:15 - 16:30
Break
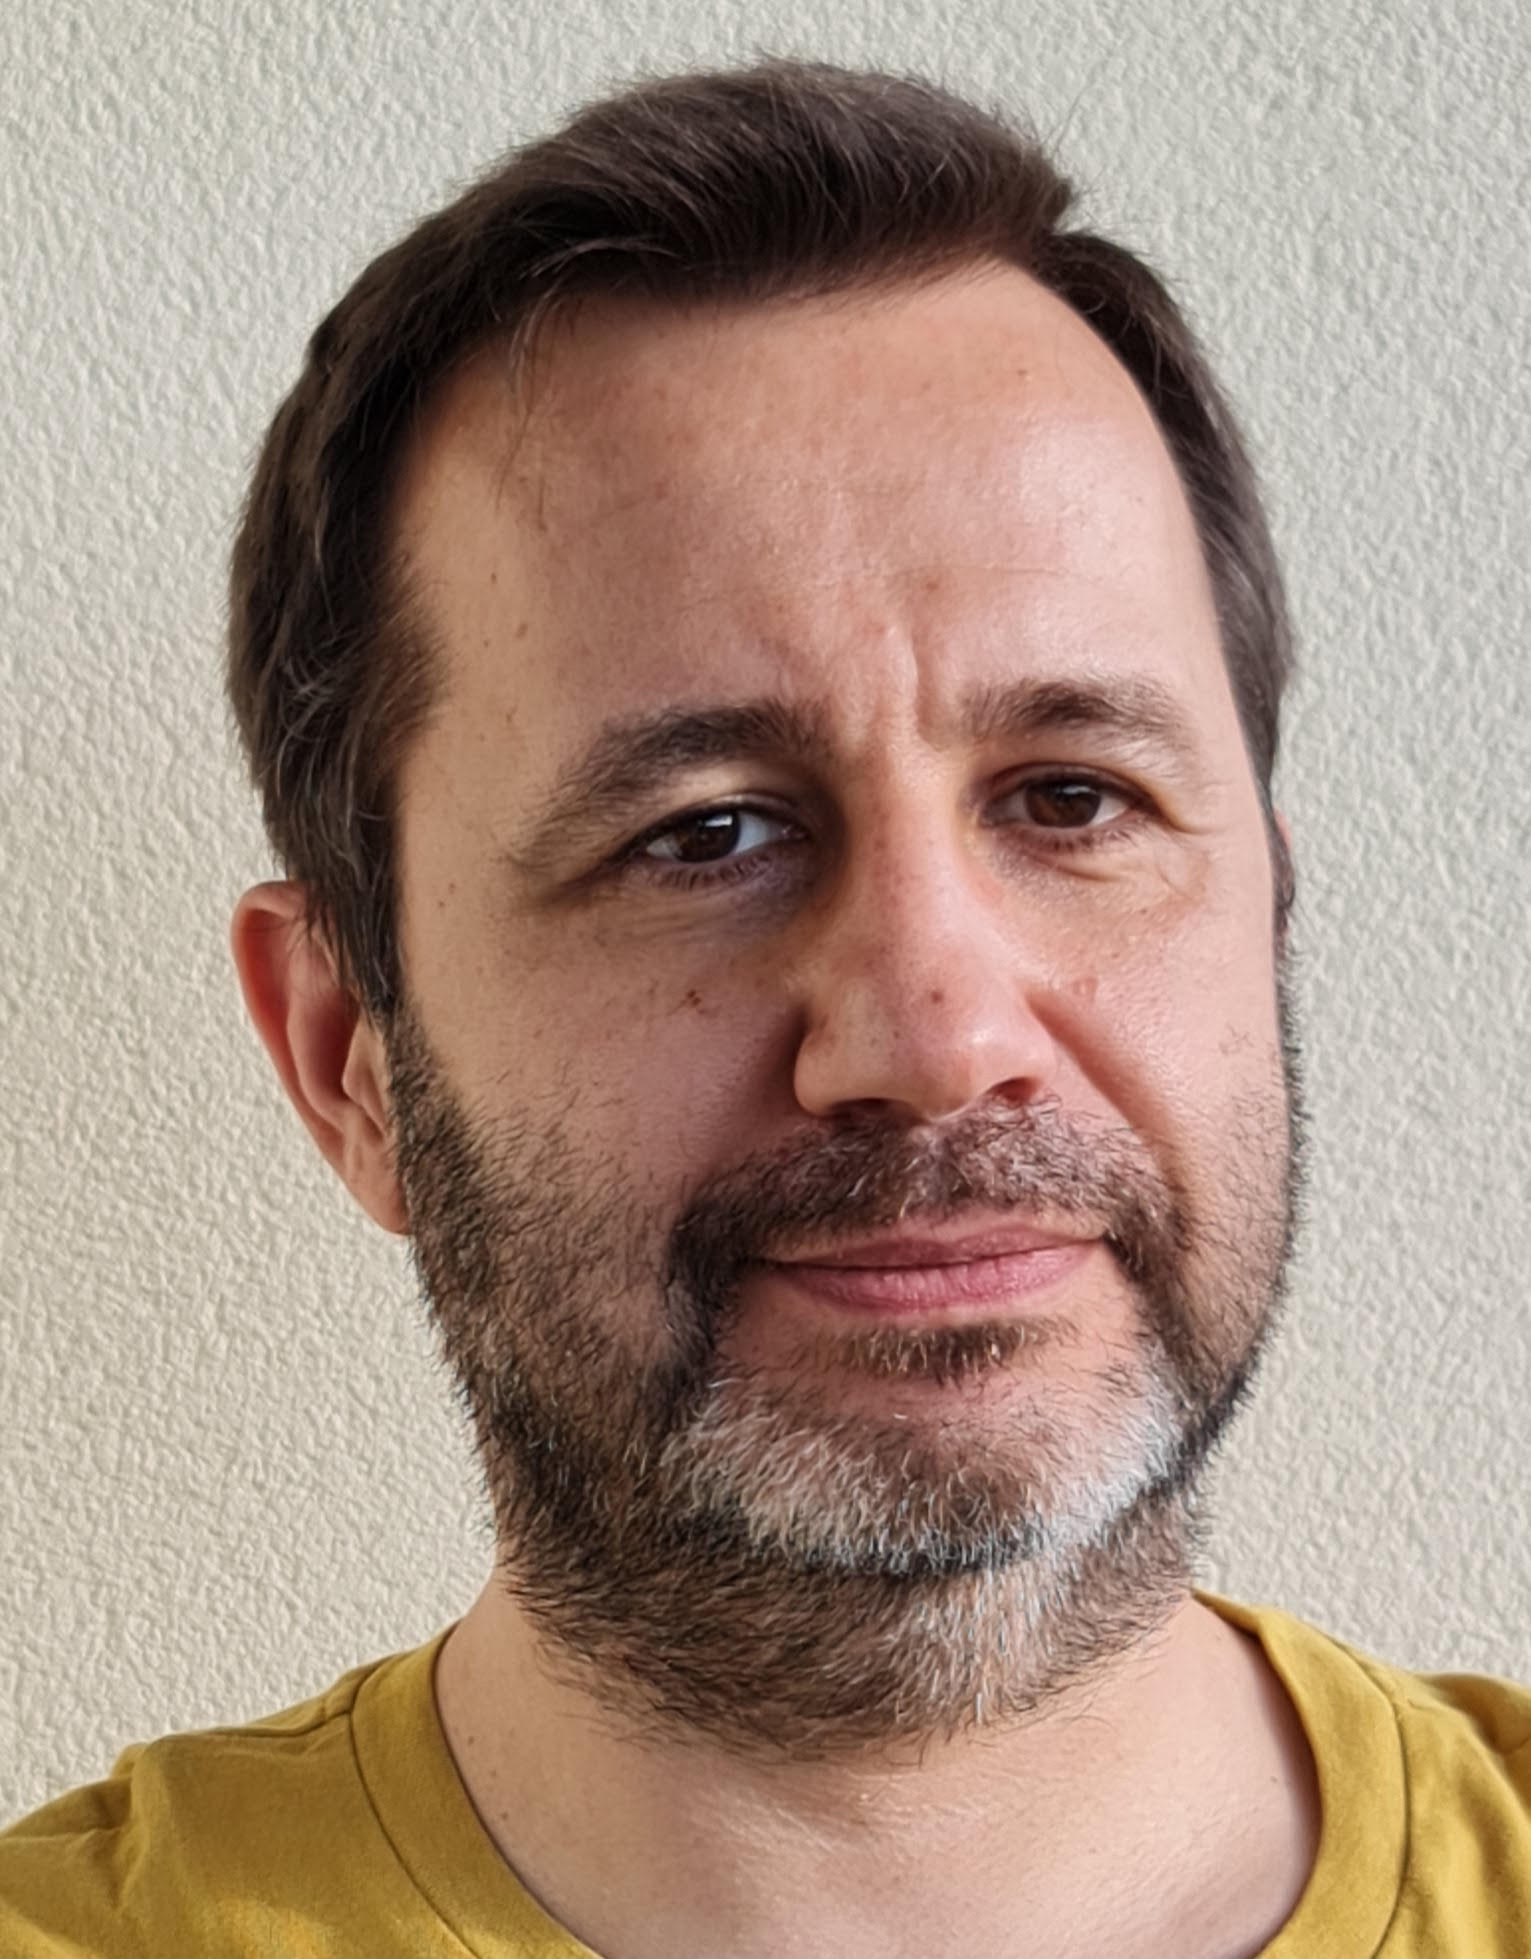
16:30 - 17:00
Visual Exploration of Patterns and Relationships in Low-Dimensional Embeddings
Speaker: Marc Streit (Johannes Kepler University Linz)
Marc Streit is a tenured Full Professor at the Johannes Kepler University Linz (JKU) in Austria where he leads the Visual Data Science Lab (https://jku-vds-lab.at/). He finished his PhD at Graz University of Technology in 2011 and moved to Linz later that year. In 2012 he was a Visiting Researcher at the Harvard Medical School. As part of a Fulbright scholarship for research and lecturing, he was a Visiting Professor at the Harvard Paulson School in 2014. Marc also teaches courses at the Imperial College Business School. His scientific areas of interest include visualization, visual analytics, and explainable machine learning. Together with his team and collaborators, he develops novel visual analysis tools for cancer research, drug discovery, and other application domains. He is a PI or Co-PI in multiple research and industry projects. Marc won multiple best paper and runner-up awards at major conferences in his field. Since 2016 he is CEO and Co-Founder of the JKU spin-off company datavisyn (https://datavisyn.io). More information can be found on https://marc-streit.com.
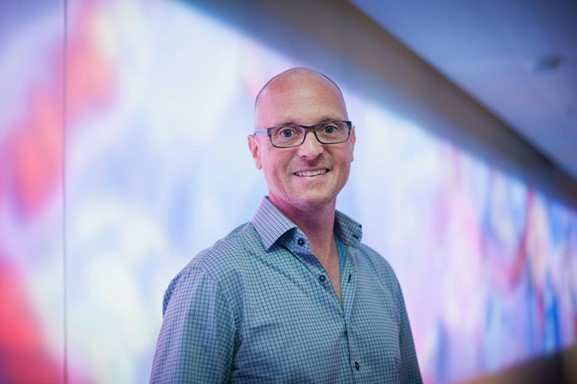
17:00 - 17:30
Visualization to Make Medical Imaging AI Useful in the Clinical Wilderness
Speaker: Claes Lundström (Linköping University, CMIV)
Claes Lundström currently holds two positions, in industry as Research Director at Sectra AB and in academia as Adjunct Professor at Linköping University. The role at Sectra is part of the management group and the responsibilities include innovation development, long-term strategies for technology adoption, and collaborations with academic partners. At Linköping University, Lundström is a leading senior researcher at the Center for Medical Image Science and Visualization (CMIV). Lundström is the director of the Analytic Imaging Diagnostics Arena (AIDA), a national initiative underpinning AI innovation in medical imaging with CMIV and Sectra as core partners. Since its start in 2003, Lundström’s research efforts have revolved around medical imaging from different technology angles – visualization, image analysis, AI, informatics and human-computer interaction. The research focus is to enable new levels of accuracy and efficiency in demanding clinical settings. The application domain spans radiology, pathology, integrated diagnostics and precision orthopedics.
17:30 - 17:45
Break
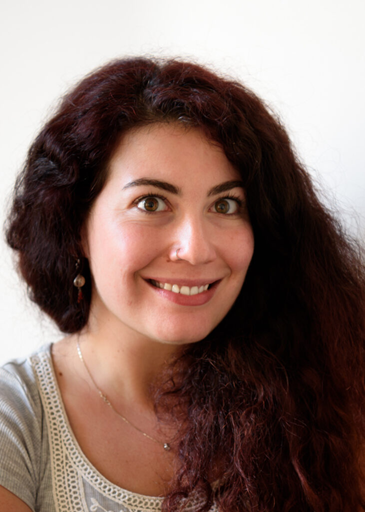
17:45 - 18:15
Can a Picture Save a 1000 Lives? BioVis in Clinical and Public Health Practices
Speaker: Anamaria Crisan (Tableau Research)
Anamaria Crisan is a multidisciplinary researcher that integrates techniques and methods from applied statistics, machine learning, human computer interaction, and data visualization. Her research focuses on the intersection of Data Science and Data Visualization, and specifically the way humans can collaboratively work together with ML/AI systems through visual interfaces. She analyzes data, builds tools, and conducts empirical study studies. She completed her PhD in 2019 at the University of British Columbia, where she was jointly advised by Tamara Munzner . Prior to her PhD, she was a research scientist at the British Columbia Centre for Disease Control and Decipher Biosciences, where she conducted research machine learning and data visualization research toward applications in infectious disease and cancer genomics.
18:15 - 18:45
Visualization for AI in Critical Domains
Speaker: Alex Bäuerle (Ulm University)

Alex is a PhD student at Ulm University. He works at the intersection of VIS and AI. In his research, he is mainly thinking about how to make AI more approachable, more interpretable, and more trustworthy using visualization. During his PhD, he had the chance to work on this with different Teams at Google.
18:45 - 19:00
Break
19:00 - 20:00
Round Table and Closing