
DataVis 10½: A practical brief intro to data
visualization
Time: 3.5 hours
Time: 3.5 hours
Laura Garrison, Amy Zhang, Pere-Pau Vázquez
Abstract:
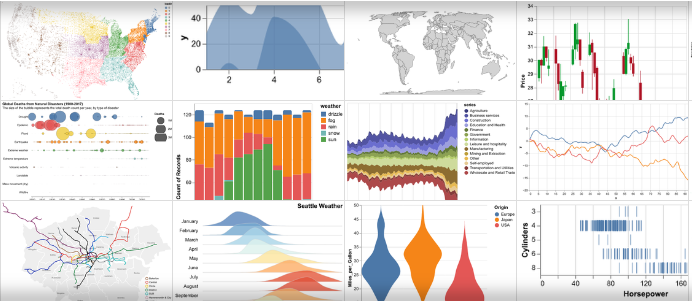
Data visualization is a proven means to engage with, explore, and contextualize
large volumes of information critical
to decision making. However, many questions must be answered to create a
visualization, such as: What color should I
use for this variable? or should I use a bar- or line-chart to find something? Poor
decisions may produce visualizations
that mislead, hide, or overstate important features of the data, while good
decisions result in clear, more honest
depictions of the data. In this hands-on tutorial, we will introduce the basics of
visualization design using the
Python Vega-Altair library.
Laura
Garrison
is an associate professor (tenure-track) of visualization in the Department of
Informatics at the University of Bergen,
and a trained medical illustrator. With her team, she studies processes and
assumptions designers make when crafting
visualizations, and their impact on audience engagement and behavior, with a special
interest in the health and life
science domains.
Amy
Zhang
is a scientifically-minded illustrator, designer, and visualization researcher. She
contributes to projects that foster
an appreciation and understanding of science within the VisGroup at the University
of Bergen and VISABLI research network
at the University of Toronto. Specifically, she is interested in the sociotechnical
contexts of visualization as well as
investigating visual representations as tools for learning and reasoning.
Pere-Pau
Vázquez
is an associate professor at Universitat Politècnica de Catalunya. He holds a PhD in
software (computer graphics)
and is currently affiliated to the ViRVIG (visualization, virtual reality and
graphical interaction) group and the
CREB center (center for research in biomedical engineering). His current interests
are scientific visualization,
information visualization, virtual reality, and applications of deep learning to
visualization.
Tutorial on Spatial Data Visualization with Inviwo
Time: 2 hours
Time: 2 hours
Martin Falk
Abstract:
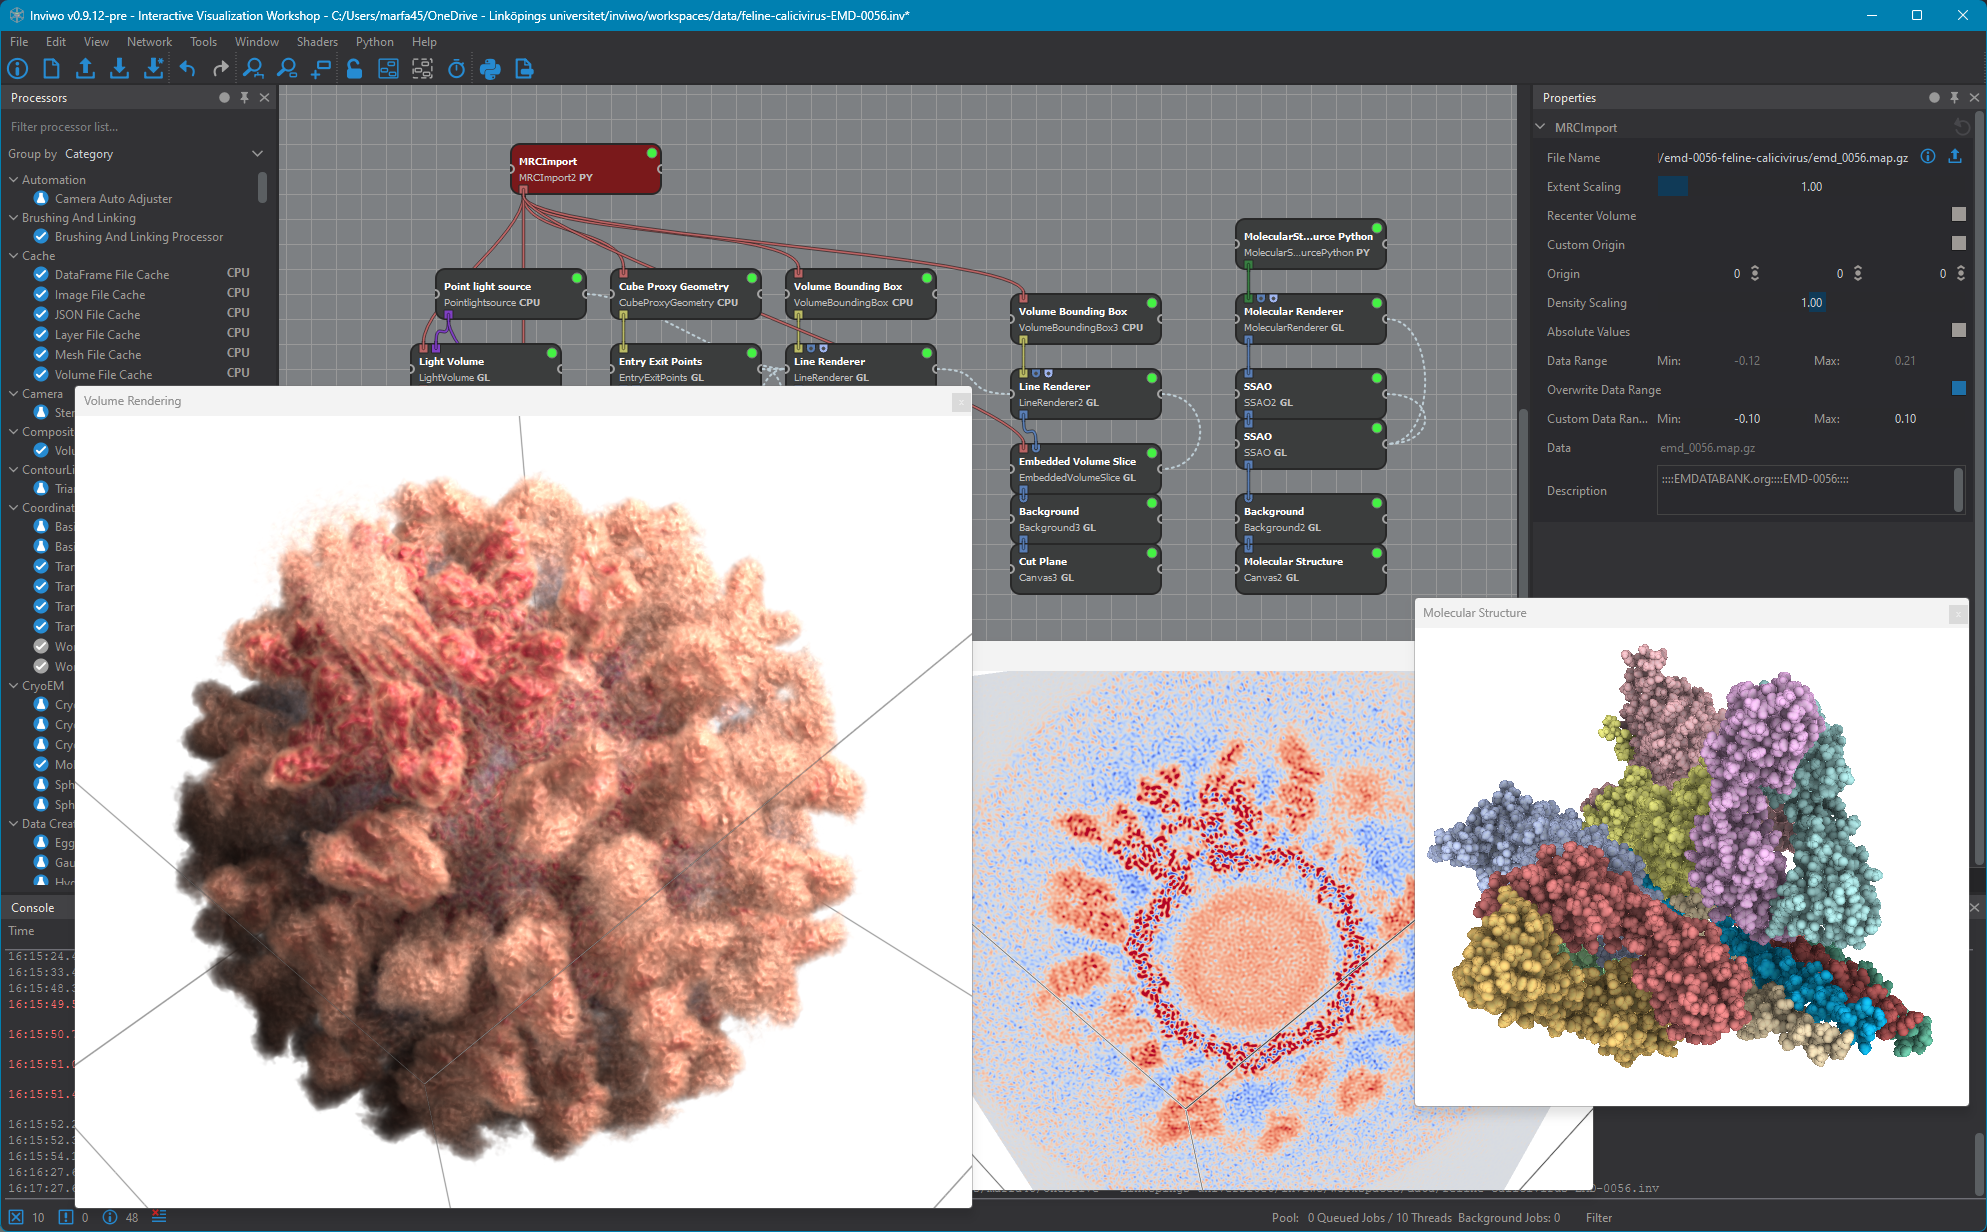
Inviwo is a rapid prototyping framework for visualizing spatial and abstract data.
In this tutorial,
we show how Inviwo can be utilized for easily creating visualizations in the
biomedical domain.
We provide an overview of the concepts used in Inviwo like its visual network editor
and the associated data flow paradigm.
Several hands-on examples illustrate how to import data and build your own
visualization networks.
The tutorial is tailored to beginners – no prior experience with the framework is
necessary.
Inviwo is available at https://inviwo.org and Github.
Martin
Falk
is an Associate Professor in the Scientific Visualization Group at Linköping
University.
He received his Ph.D. degree (Dr.rer.nat.) from the University of Stuttgart in 2013.
His research focuses on the development and utilization of visualization techniques,
like volume rendering,
topological analysis, and GPU-based methods in general, tailored to specific
applications in various application
domains including cryo-EM, material science, plasma physics as well as the medical
domain. He is also a core
developer of the visualization framework Inviwo.
Collaboration & Networking
Time: ~1 hour
Time: ~1 hour
Organizers
One of the best things about summer schools is meeting new people. We hope that this
one
will not be an exception. The school is open to attendees with diverse
expertise/interest areas spanning biology, medicine, and visualization.
This means there is a unique opportunity to learn from one another, look at the
research activities from different perspectives, and
maybe even build future collaborations. In this session, you will get a chance to
discuss with fellow
summer school attendees and find out how research is done in their research group,
what problems do they encounter, and how are they approaching them.
Note: Since the nature of this session strongly depends on the expertise/interest
areas of the attendees, it is subject to change. We will tailor the contents of the
session
and activities to the profile of registered attendees.