| CEST | Tuesday, 19th September 2023 | Wednesday, 20th September 2023 |
|---|---|---|
| 09:00 - 10:15 |
Crash-Course in Creating Biomedical Graphics (Workshop)
|
|
| 10:15 - 10:45 | ||
| 10:45 - 12:00 | ||
|
Crash-Course in Creating Biomedical Graphics (Workshop)
|
||
|
Organizers
|
||
| 12:00 - 13:30 | ||
| 13:30 - 13:40 |
Opening
|
|
| 13:40 - 14:35 |
A Pipeline for Image-Based Modeling & Simulation of Cardiac Hemodynamics
|
|
| 14:35 - 15:30 |
Theme: Blood Flow Visualization
|
|
| 15:30 - 16:00 | ||
| 16:00 - 17:00 |
Image Analysis of Biological Structures
|
|
| 17:00 - 18:00 |
Single-cell Data and Dimensionality Reduction Techniques
|
|
Tuesday
12:00 - 13:30
Registration
13:30 - 13:40
Opening
Speaker: Organizers
13:40 - 14:35
A Pipeline for Image-Based Modeling & Simulation of Cardiac Hemodynamics
Speaker: Jonas Lantz (Linköping University Hospital)
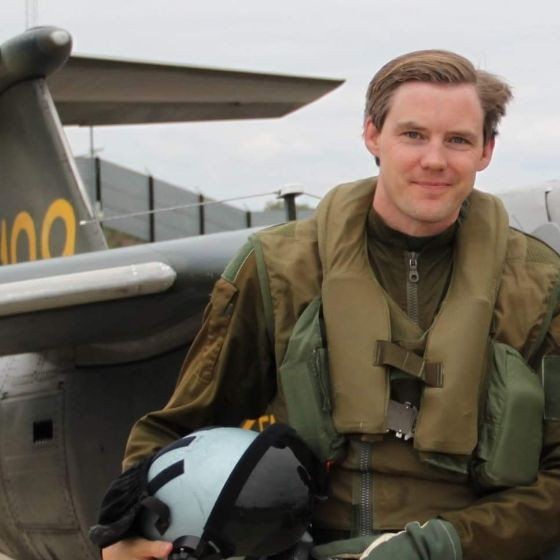
Dr Jonas Lantz is currently a researcher at the Division of Diagnostics and Specialist Medicine at Linköping University Hospital, Sweden where he is part of the Cardiovascular Imaging and Modeling research cluster. He earned his PhD in Computational Fluid Dynamics in 2013 and has previously worked as an assistant professor at Linköping University. His research interests include cardiac flow simulations and measurements, medical imaging with CT and MRI and development of imaging biomarkers for cardiovascular risk assessment. In addition to his academic career, he has previously worked as a Flight Test Engineer with focus on flight dynamics on the Gripen Fighter aircraft at SAAB, and as a technical researcher at CERN, Geneva, Switzerland.
Abstract: In this presentation, we will discuss modeling and simulation of cardiac hemodynamics, and how it can transform our understanding of cardiovascular health. We will begin with a brief introduction to various imaging modalities and fundamental cardiac physiology. This introduction will help provide the rationale for our research. Then, starting from the initial clinical image acquisition process, we will trace the journey that leads us to computed flow fields within the heart and how it is applied in the clinic and improves patient care.
14:35 - 15:30
Theme: Blood Flow Visualization
Speaker: Ingrid Hotz (Linköping University)
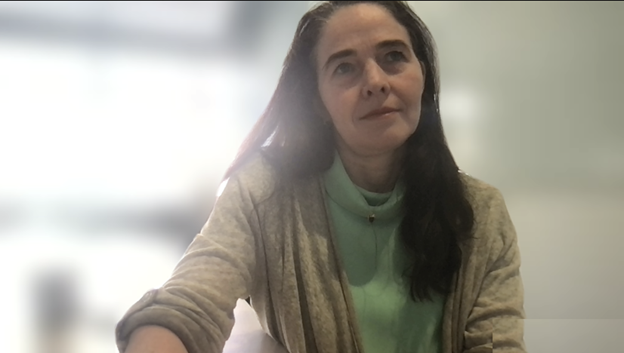
Ingrid Hotz is a professor in Scientific Visualization at Linköping University, Sweden. She received her M.S. degree in theoretical Physics from the LMU Munich, Germany and the PhD degree from the CS Department at the University of Kaiserslautern, Germany. Since then she has spent some time at the University of California Davis, at the Zuse Institute in Berlin, and at the German Aerospace Center (DLR). Currently she leads the Scientific Visualization Group at the division for Media and Information Technology at LiU. She is serving as Chair of the international workshop series for ‘Topological Methods in Visualization (TopoinVis)’ and is the coordinator of the Swedish e-sciences Research Center (SeRC) Visualization Community. Her research interest lies in the area of data analysis and scientific visualization, ranging from basic research questions to effective solutions to visualization problems in applications including flow analysis, engineering, physics, and medical applications. Her research builds on ideas and methods originating from different areas of computer sciences and mathematics, such as computer graphics, computer vision, dynamical systems, computational geometry, and combinatorial topology.
15:30 - 16:00
Coffee Break
16:00 - 17:00
Image Analysis of Biological Structures
Speaker: Daniel Baum (Zuse Institute Berlin)
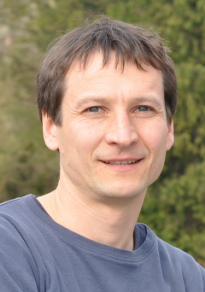
Daniel Baum is head of the research group Visual Data Analysis and deputy head of the department Visual and Data-centric Computing at Zuse Institute Berlin (ZIB). He studied computer science at Humboldt University Berlin (HUB), Germany, and the University of Edinburgh, Scotland, and received his MS degree from HUB. During his PhD at ZIB and Freie Universität Berlin, he worked in the fields of molecular visualization and similarity analysis. In his current work, he leads quite diverse projects, from neurobiology to meteorology to the virtual unfolding of ancient written documents, but his greatest passion lies in analyzing biological data. His research interests include visualization, image segmentation, feature extraction, feature tracking, as well as shape analysis.
Abstract: The analysis of biological structures usually starts with the imaging of a biological specimen. This results in a 3D digital image. In order to analyze the structures of interest in this image, its segmentation is a prerequisite. If several images are created over time, we even have to deal with 4D (3D+t) data, additionally requiring feature tracking over time. In this lecture, I will start with some basic segmentation methods, including watershed segmentation and distance fields, but I will also present more advanced methods like ambient occlusion for cavity segmentation, template matching for feature extraction, and, if time allows, shape model-based image segmentation. The issue of tracking structures over time will also be briefly touched upon. All methods will be illustrated using examples from real-world data. Machine learning techniques for image analysis will not be covered in the lecture.
17:00 - 18:00
Single-cell Data and Dimensionality Reduction Techniques
Speaker: Thomas Höllt (TU Delft)
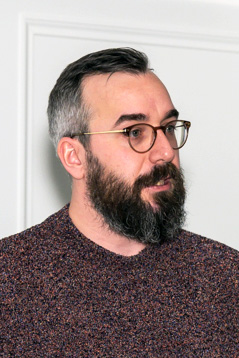
Thomas Höllt is an Assistant Professor in the Computer Graphics and Visualization Group (CGV) at Delft University of Technology. Before that, he was Assistant Professor in the Leiden Computational Biology Center (LCBC) at the Leiden University Medical Center. He has been awarded the Dirk Bartz Prize for Visual Computing in Medicine in 2019 and the third prize in 2021 for his work on visual analytics approaches in (spatial) single-cell analysis. In 2023, he was awarded the VRVis Visual Computing award for sustainable development for his work on Cytosplore. His research interests include visualization and visual analytics for high-dimensional data, with a focus on biomedical applications, in particular, applications using -omics data.
Abstract: Novel methods for capturing and analyzing protein and gene expression on single-cell data have revolutionized systems biology and cell biology in recent years, providing insights into the interplay of cellular functions of living organisms. These methods commonly produce huge, complex, high-dimensional data that needs to be analyzed. In this lecture, we will discuss dimensionality reduction methods, and how they are used to visualize these data. We will discuss the principle of principal component analysis (PCA) and neighborhood embeddings (t-SNE/UMAP/HSNE), their advantages and disadvantages, as well as pitfalls, when used in explorative data analysis. Finally, we will discuss specific applications in single-cell analysis.
Wednesday
09:00 - 10:15
Crash-Course in Creating Biomedical Graphics (Workshop)
Speaker: Laura Garrison (University of Bergen)
Laura Garrison is a visualization researcher and biomedical illustrator currently affiliated with Bouvet ASA and the Mohn Medical Imaging and Visualization Centre, Haukeland University Hospital in Bergen, Norway. She received her PhD in Visualization from the University of Bergen for her work on multiscale visualization of human physiology for discovery and communication. She is a recipient of the Karl-Heinz Höhne (MedVis) Award (2021) and the Dirk Bartz Prize this year. Prior to her PhD, she worked as an artist and content director in medical education technology start-ups in Chicago, Silicon Valley, and New York City. She is passionate about combining art, science, and technology to ask better questions and share stories about data, particularly for the life sciences.
Abstract: In this hands-on tutorial, you will learn theory and techniques to visually communicate your science to a wide range of audiences. Although this tutorial focuses primarily on biomedical communication, the content from this tutorial is broadly applicable to other areas. We will cover principles of graphic design, and how to apply these principles in practice to create graphical abstracts, scientific figures, research posters, and outreach material that illustrate your research. You will receive a crash-course in illustration and layout using Figma, a popular cloud-based application in the design industry. Working from either some sample datasets or from your own research, we will work through the complete design pipeline, beginning with sketching and ideation on through a final result.
10:15 - 10:45
Coffee Break
11:00 - 11:55
Crash-Course in Creating Biomedical Graphics (Workshop)
Speaker: Laura Garrison (University of Bergen)
Laura Garrison is a visualization researcher and biomedical illustrator currently affiliated with Bouvet ASA and the Mohn Medical Imaging and Visualization Centre, Haukeland University Hospital in Bergen, Norway. She received her PhD in Visualization from the University of Bergen for her work on multiscale visualization of human physiology for discovery and communication. She is a recipient of the Karl-Heinz Höhne (MedVis) Award (2021) and the Dirk Bartz Prize this year. Prior to her PhD, she worked as an artist and content director in medical education technology start-ups in Chicago, Silicon Valley, and New York City. She is passionate about combining art, science, and technology to ask better questions and share stories about data, particularly for the life sciences.
Abstract: In this hands-on tutorial, you will learn theory and techniques to visually communicate your science to a wide range of audiences. Although this tutorial focuses primarily on biomedical communication, the content from this tutorial is broadly applicable to other areas. We will cover principles of graphic design, and how to apply these principles in practice to create graphical abstracts, scientific figures, research posters, and outreach material that illustrate your research. You will receive a crash-course in illustration and layout using Figma, a popular cloud-based application in the design industry. Working from either some sample datasets or from your own research, we will work through the complete design pipeline, beginning with sketching and ideation on through a final result.
11:55 - 12:00
Organizers
Speaker: Closing
12:30 - 13:30
Lunch
13:30 - 18:00
VCMB